UPDATE: There’s a special meeting of the Buffalo County Board on Tuesday, June 6th at 7pm in the Nelson Community Hall (S105 N Main Street, Nelson, WI 54756) to discuss this plan. Representatives from the COE will be there.
UPDATE: I’ve revised and corrected the slides in this post in anticipation of the meeting. Click HERE to download the updated slides in PDF format. Especially aimed at those of you planning to attend the public hearing in Nelson.
UPDATE: I’ve revised this post to stitch in the new version of the slides
The Army Corps of Engineers has released a report describing their proposed 40-year plan for disposing of dredge sand in our area.
Here’s a link to the planning document.
Lower Pool 4 Dredged Material Management Plan
Note that public comments are due by June 9th [UPDATE] June 23rd [UPDATE-2] July 14th Instructions for submitting them are on the site as well.
I decided to focus on truck trips through our one-street river towns. I want to be clear, there are other issues with this study (e.g. the unsustainable model of converting farm land into dumps for river sand — 200 years of that and we’ll look like the Sahara Desert around here) but I’m leaving those conversations to others. Truck trips, that’s my bag. This report was confusing me, so I made some pictures to understand it better. I’m hoping they will help you too.
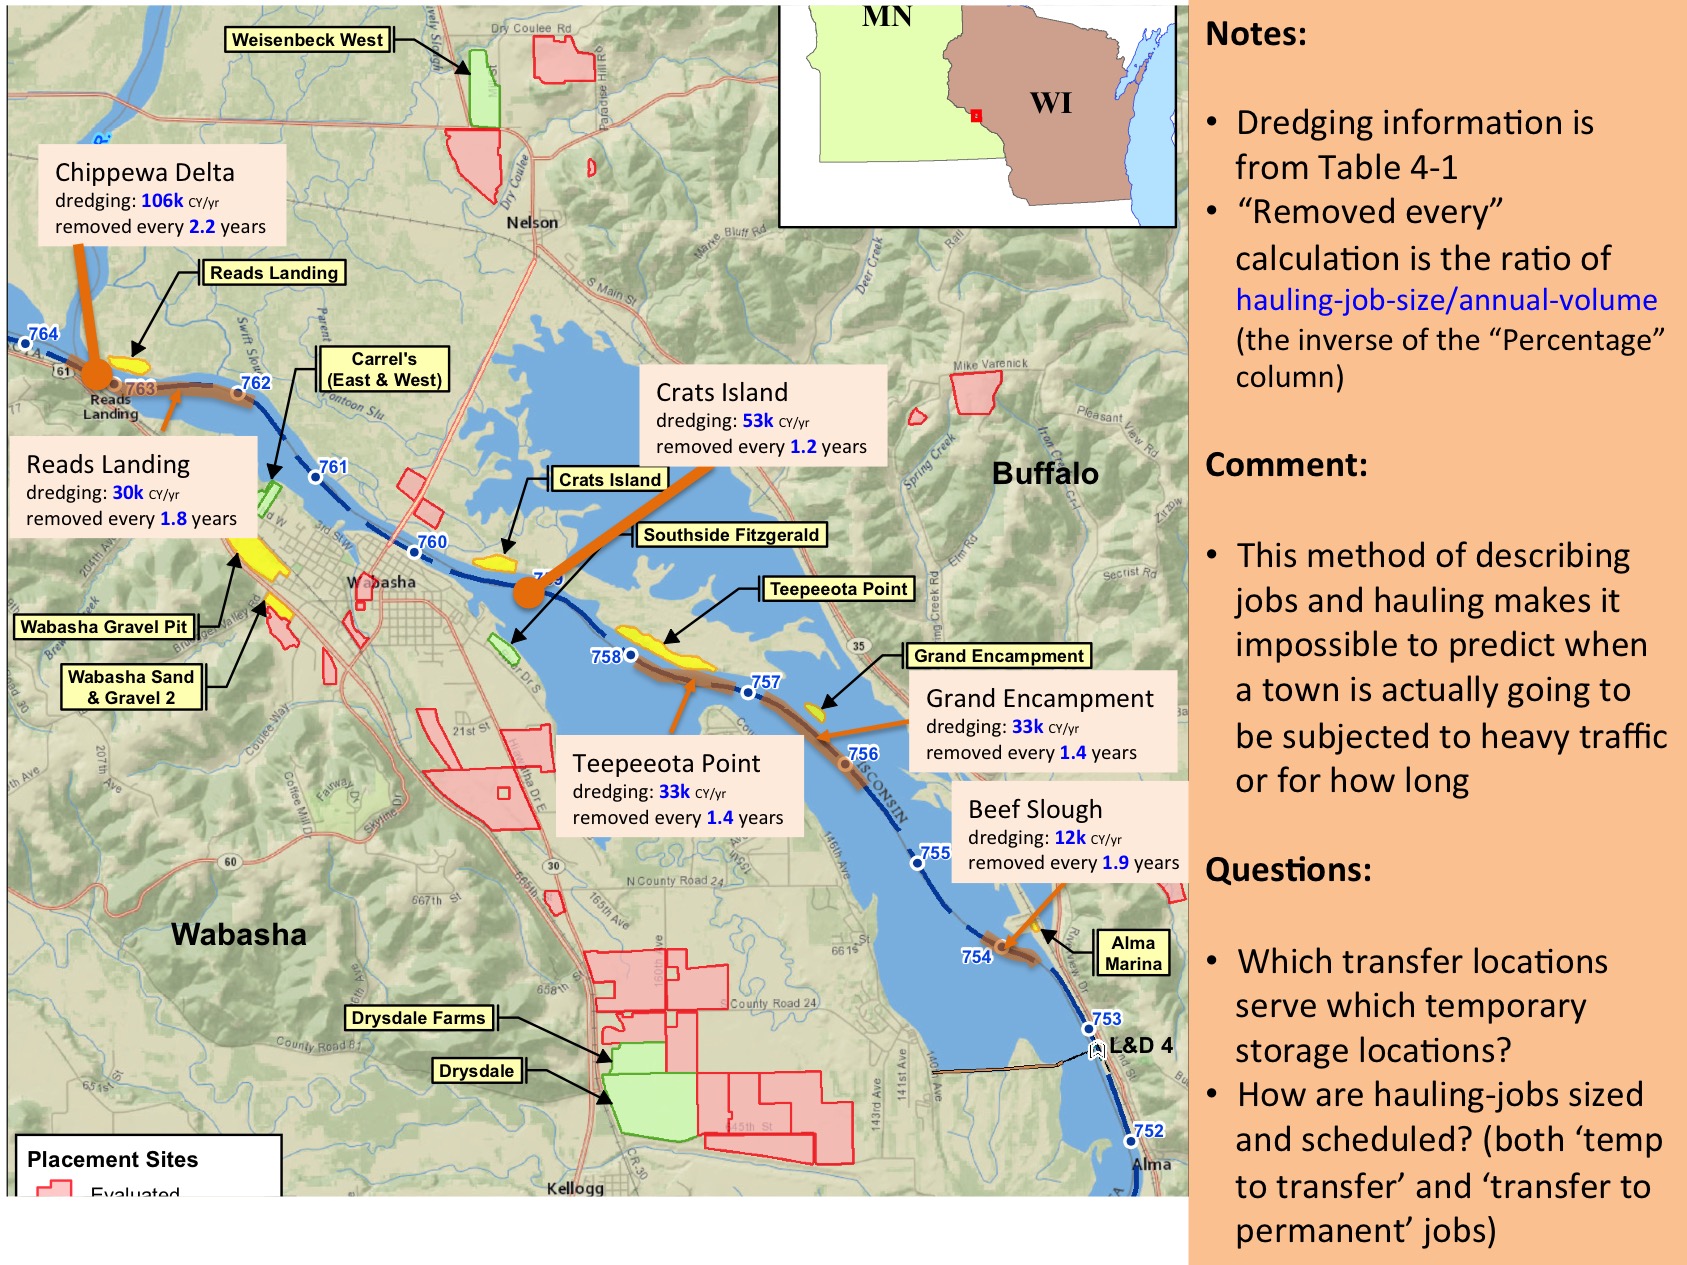
This first one summarizes the dredging activity in Pool 4 — which is the focus of this plan. I’ve added little boxes that show where the dredging locations on the river, how much sand they typically produce every year and how often that sand is hauled from the pile of sand on shore to a storage location.
Note my questions. This report has a lot of holes in it, so I can’t trace where the sand goes from end to end, nor can I tell how often those projects happen. The questions down the side are partly documenting those puzzlers as I encountered them and partly advocating things to do.
As with all these slides, click on it to get a full-sized version.
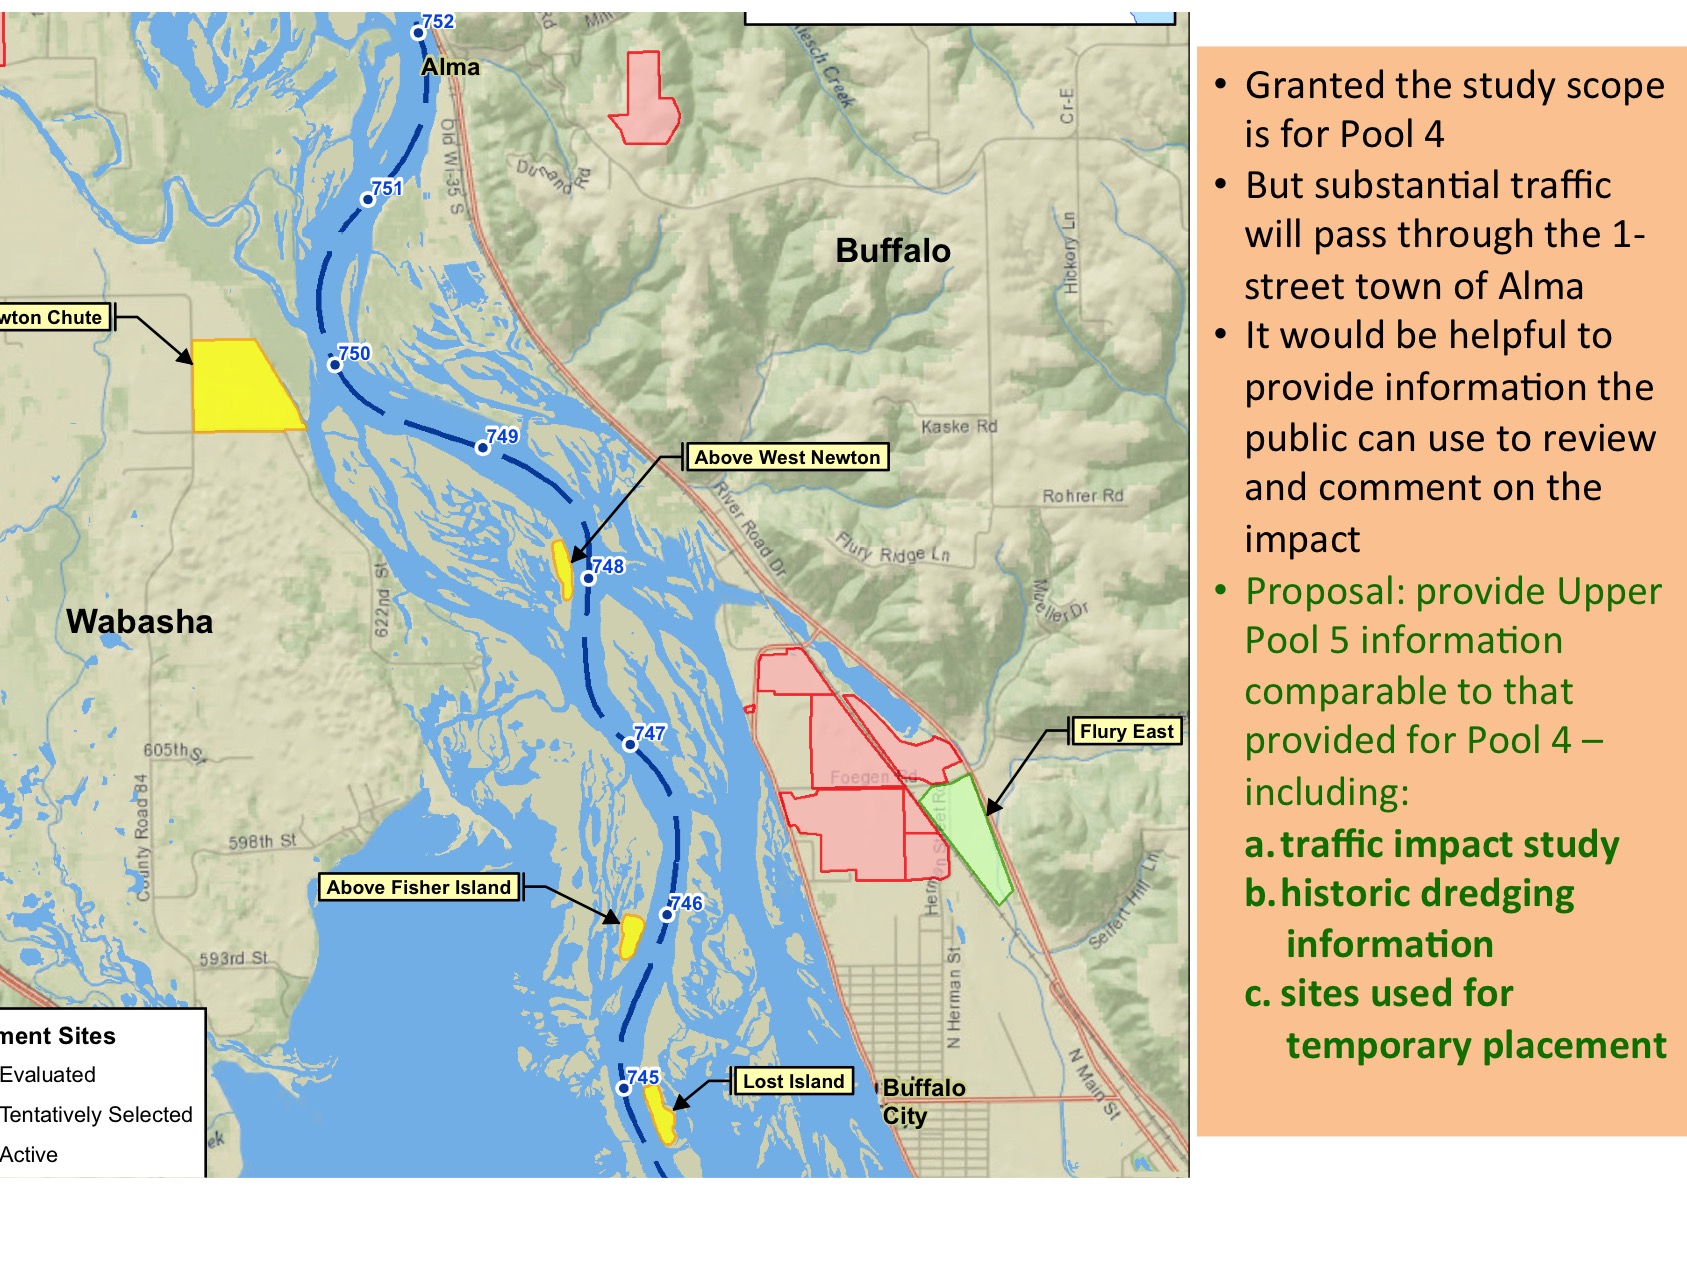
 The next slide is my attempt to create a similar picture for the pool to the south — but that information isn’t in the report. I’m very interested in promoting and protecting the Great River Road and wanted to see a traffic impact study of the trips through Alma. But the scope of this study is only Pool 4, not Pool 5 and so they didn’t develop a lot of the activity information shown in the first map. I gently disagree with that approach, since that information is really important to evaluate what happens to Alma and the Great River Road.
 This slide highlight the haul routes proposed/preferred to move sand in and around Pool 4. They’re pretty well documented in the report, but the information is scattered and I just pull it together. Note that I think there’s an error, however.
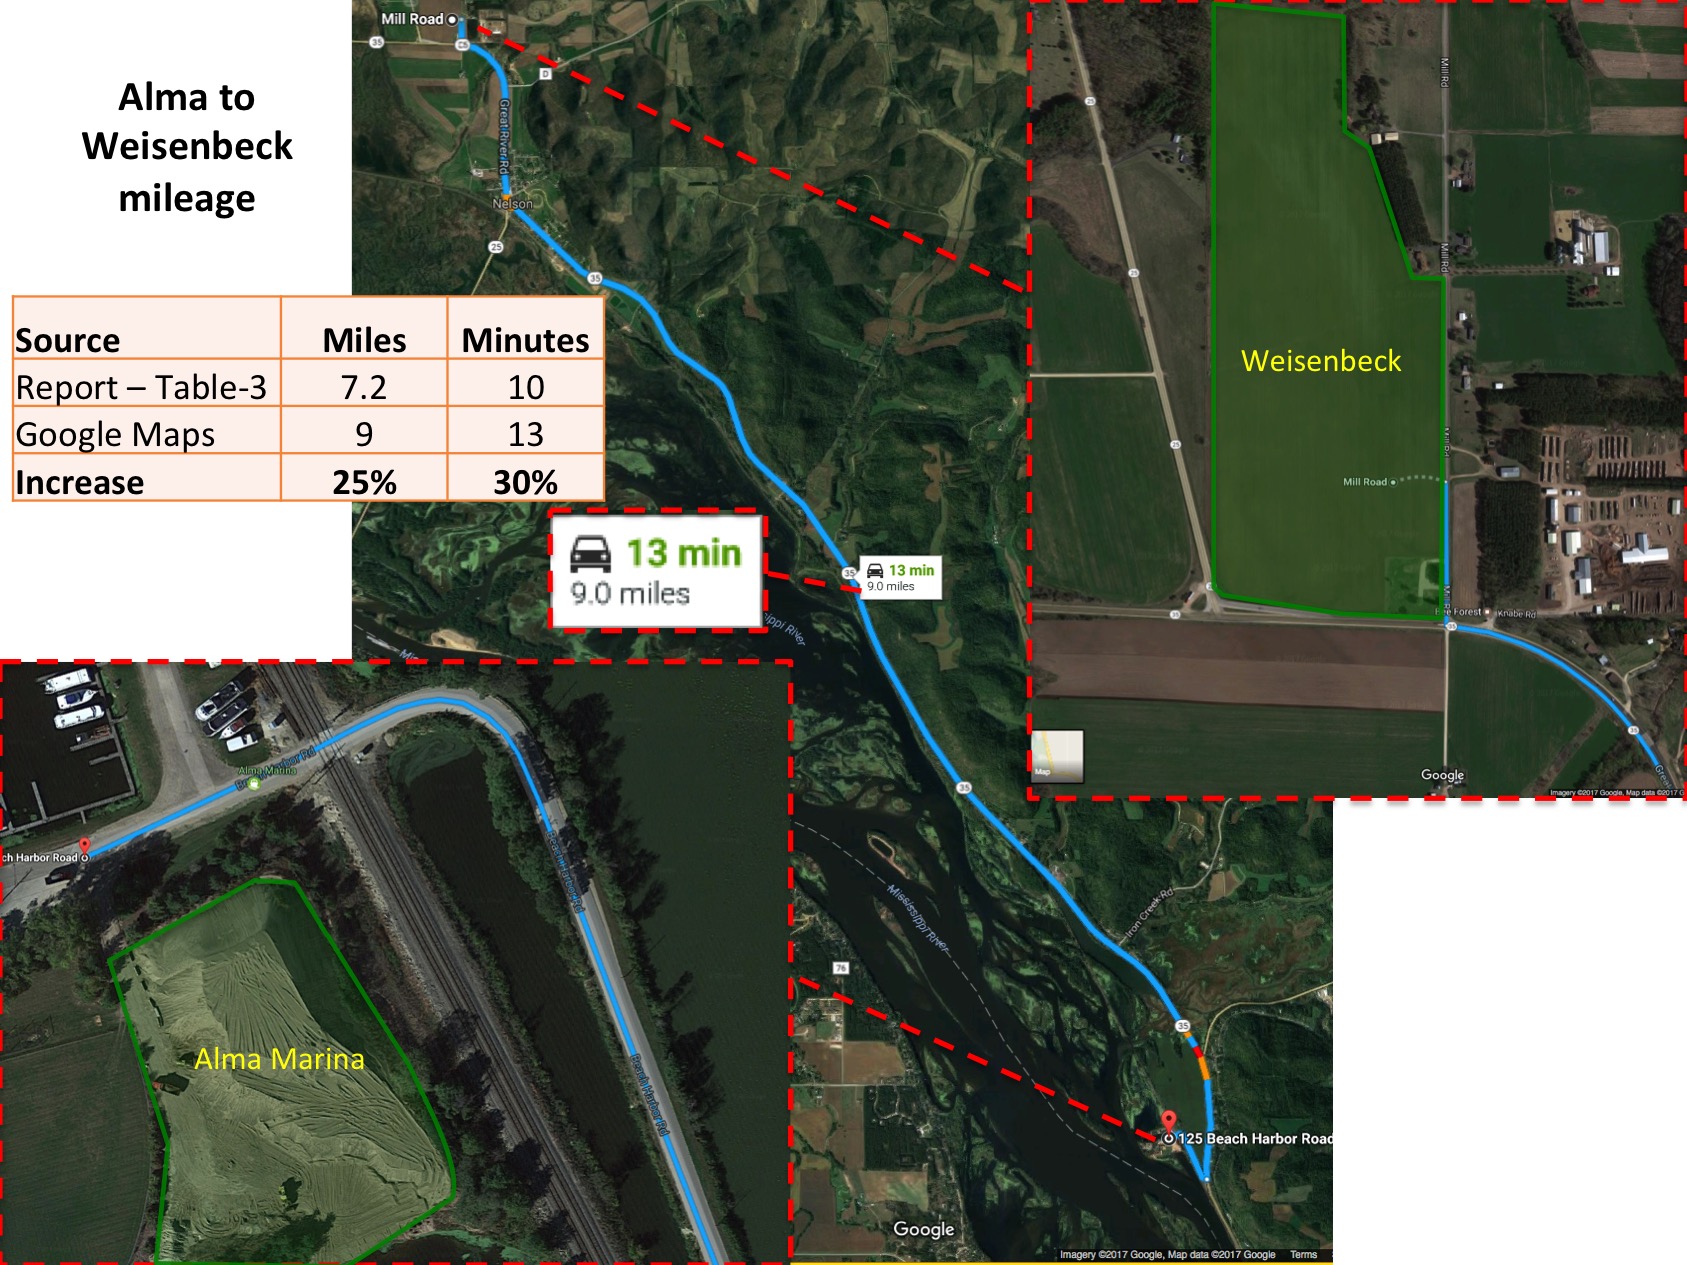
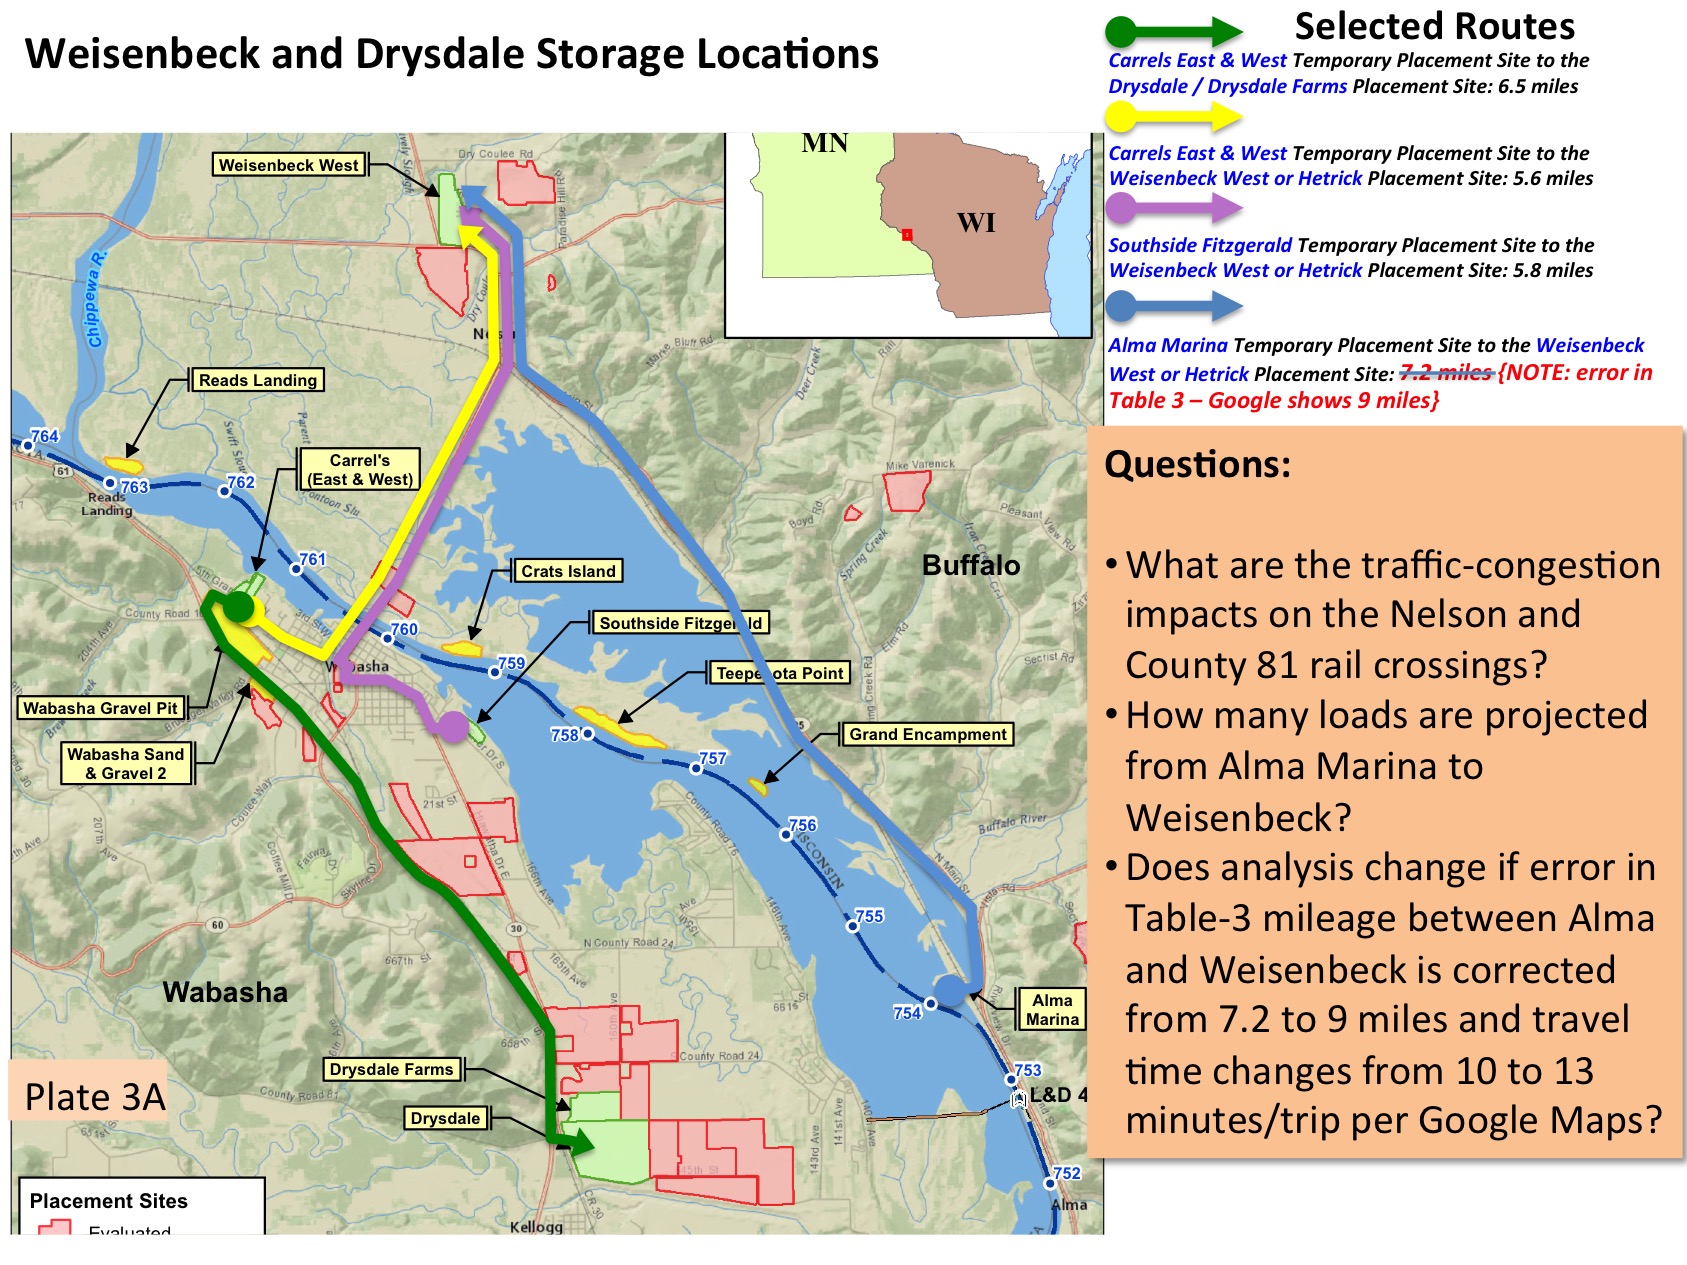 Here’s a slide to document my conclusion that they got the distance between Alma Marina and the Weisenbeck farm wrong. It’s a pretty substantial difference, but as far as I can tell I don’t think they’re planning to use that route much. Unfortunately there are inconsistencies in the report — some places state that sand will only go south out of Alma Marina, other places state it will go both ways. And sketchy documentation of frequency and volume.
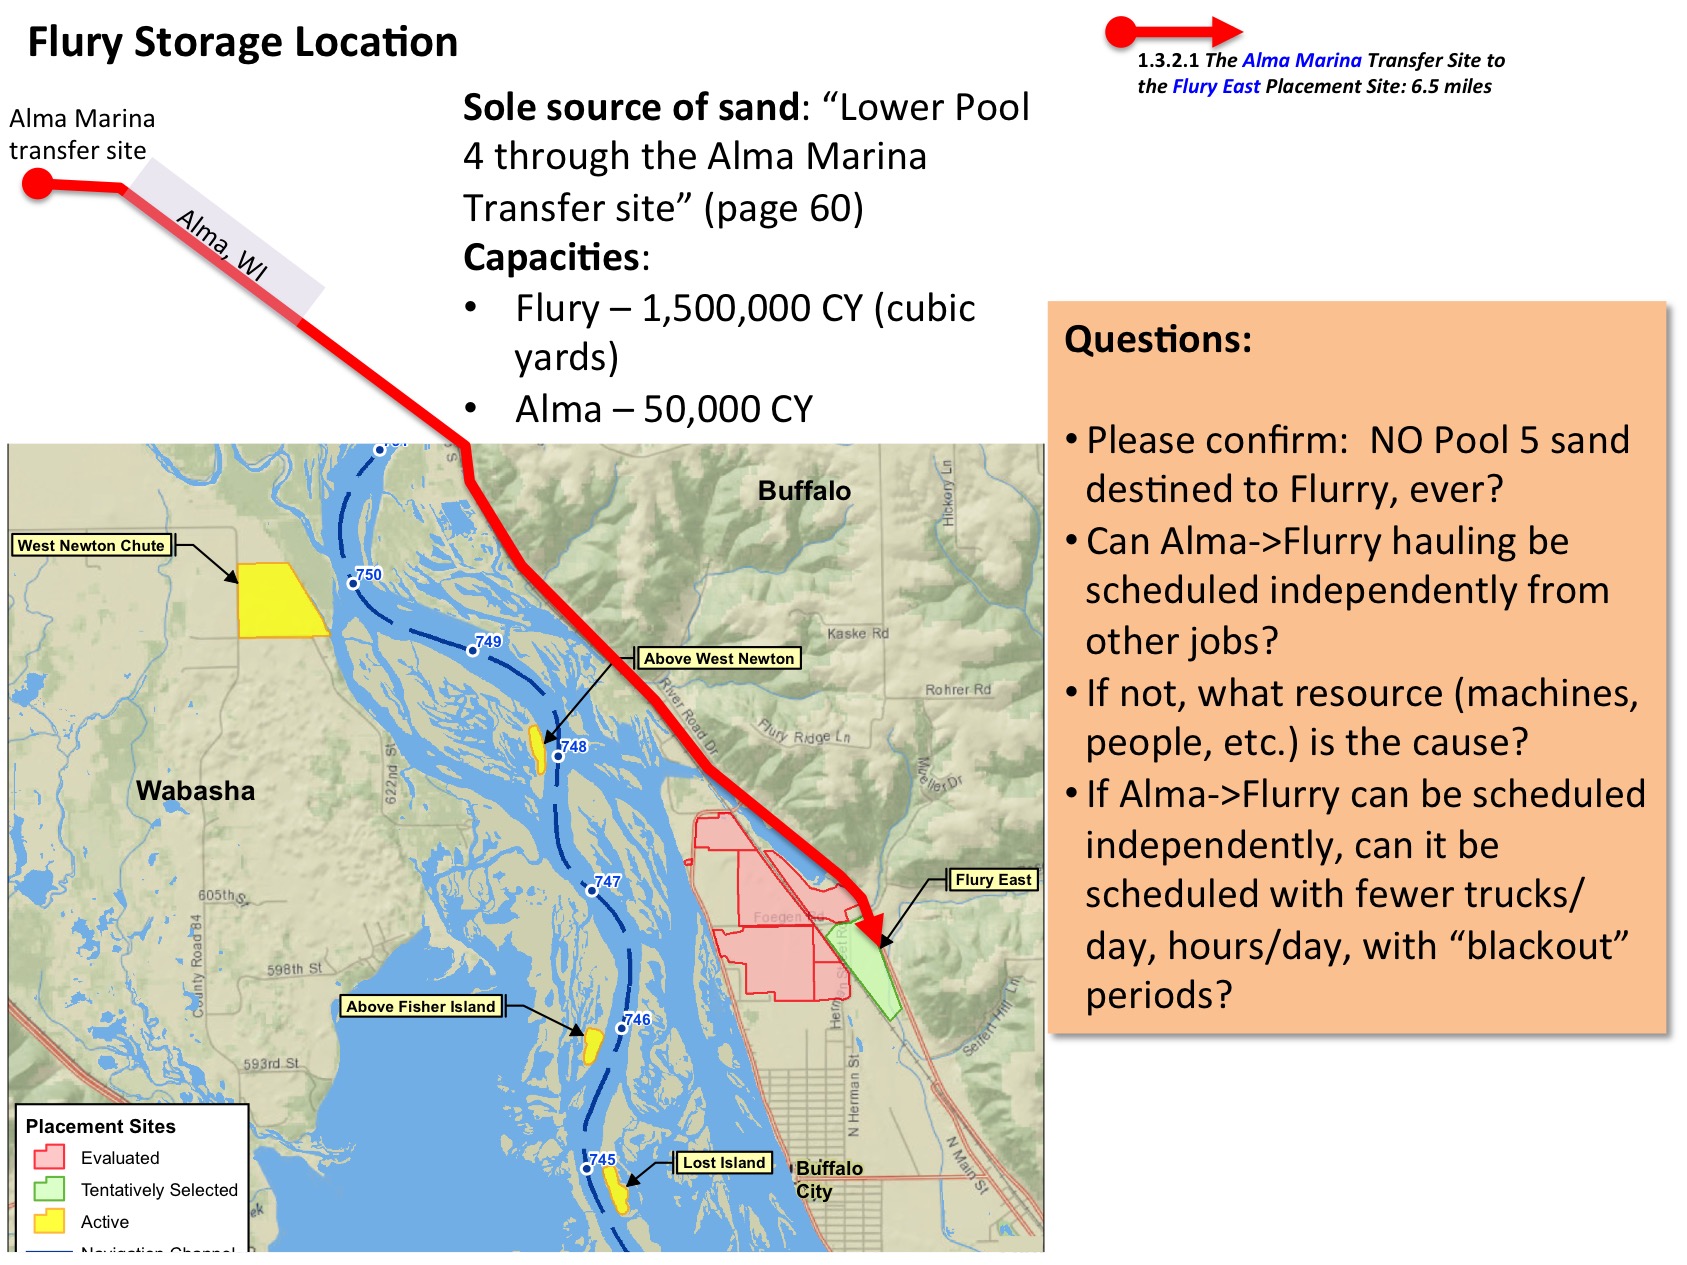
 This second haul-route slide creates information by guessing a few things, because this route is not as well documented in the report (especially painful is the lack of a Traffic Impact Study). This is my best guess, given what’s there.
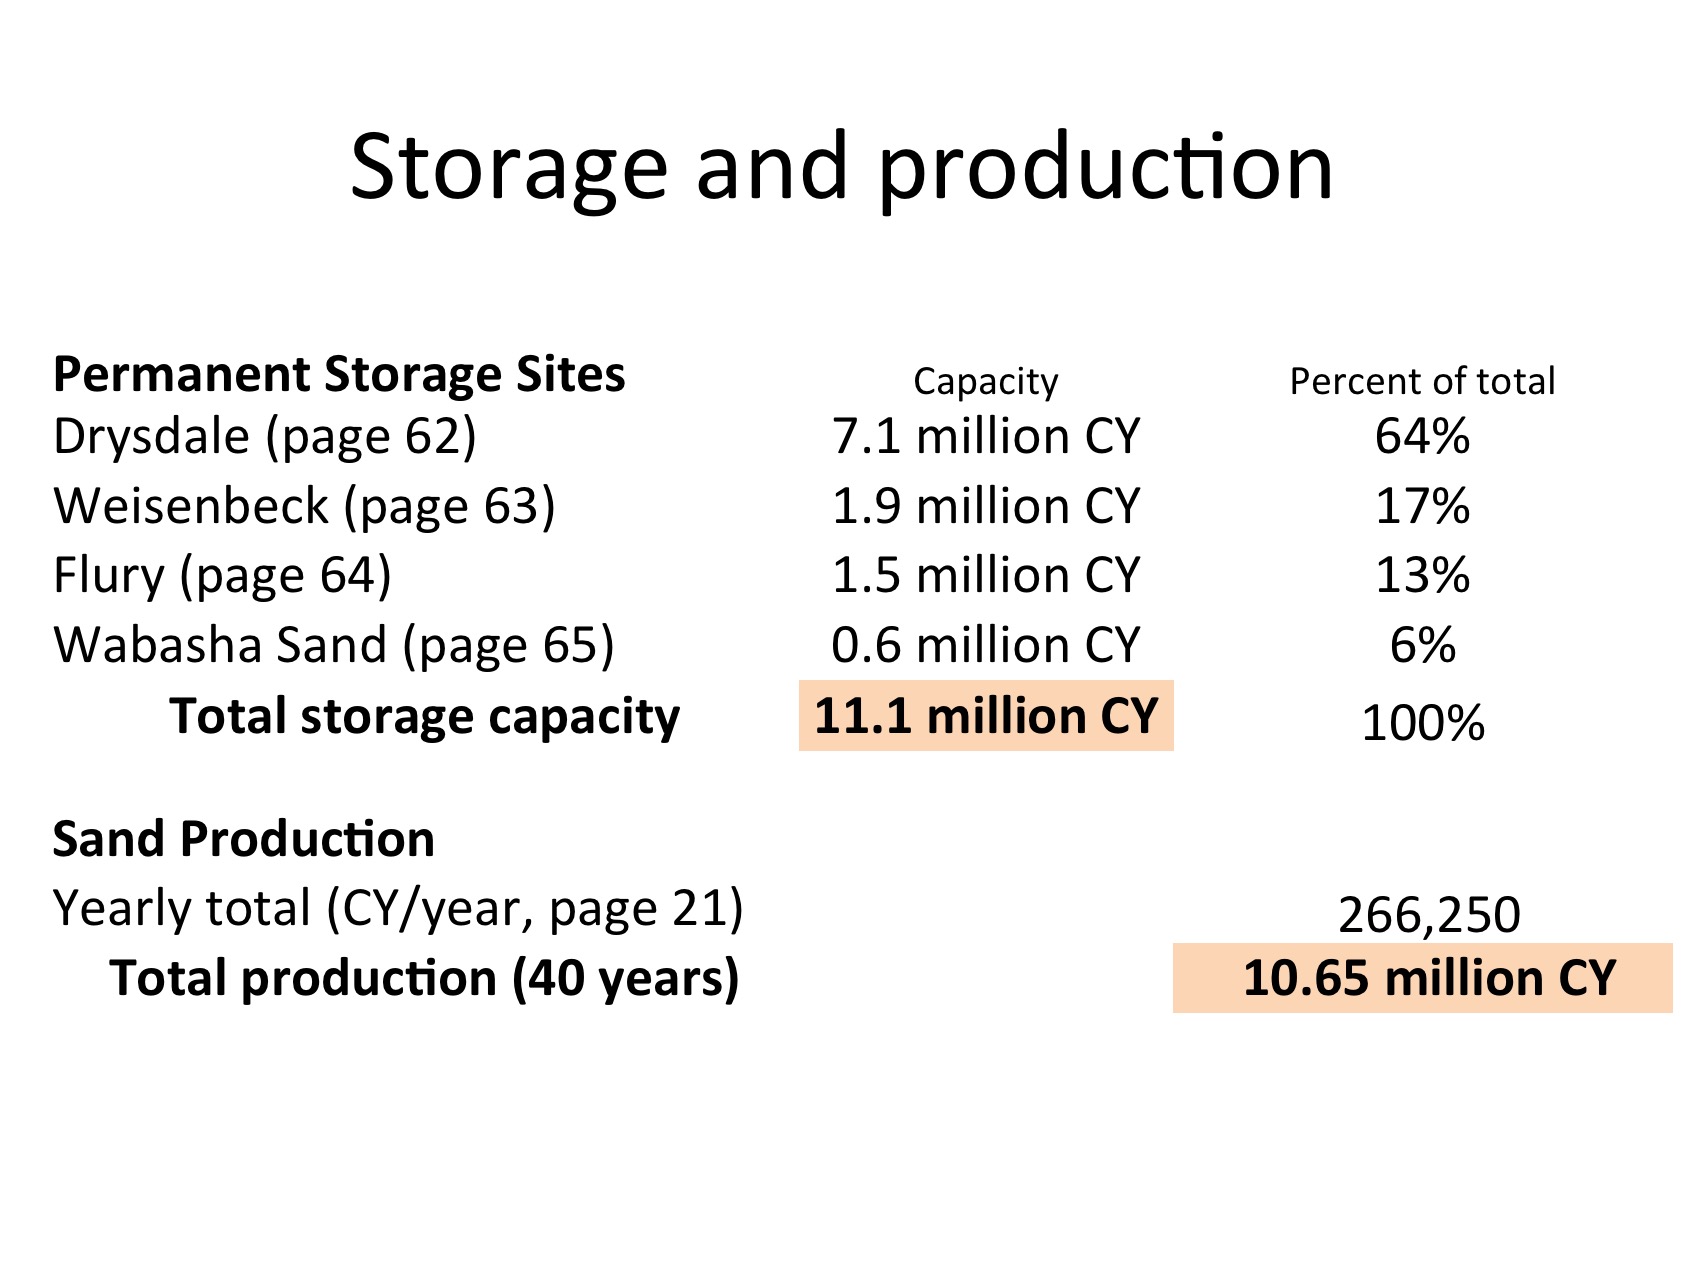
The next series of slides is trying to arrive at the answer to my main question — which is “how many truck trips and when will they happen?” As you’ll see, the methodology used in the study makes this question impossible to answer accurately. The best I can do is to document yearly averages, which isn’t satisfactory because it’s possible that a town will see huge swings from year to year.
Unfortunately the report splits the analysis between total production and destination-capacity in a way that contributes to the difficulty in arriving at an accurate projection of traffic on routes. And the numbers are also spread throughout the report. Here is where we start.
 Here’s a discussion of our old friends “loads” and “trips” which I stuck in because there’s an error in the report that confuses those two terms and I wanted to make sure that their “90 seconds between trucks” estimate was right. It is.

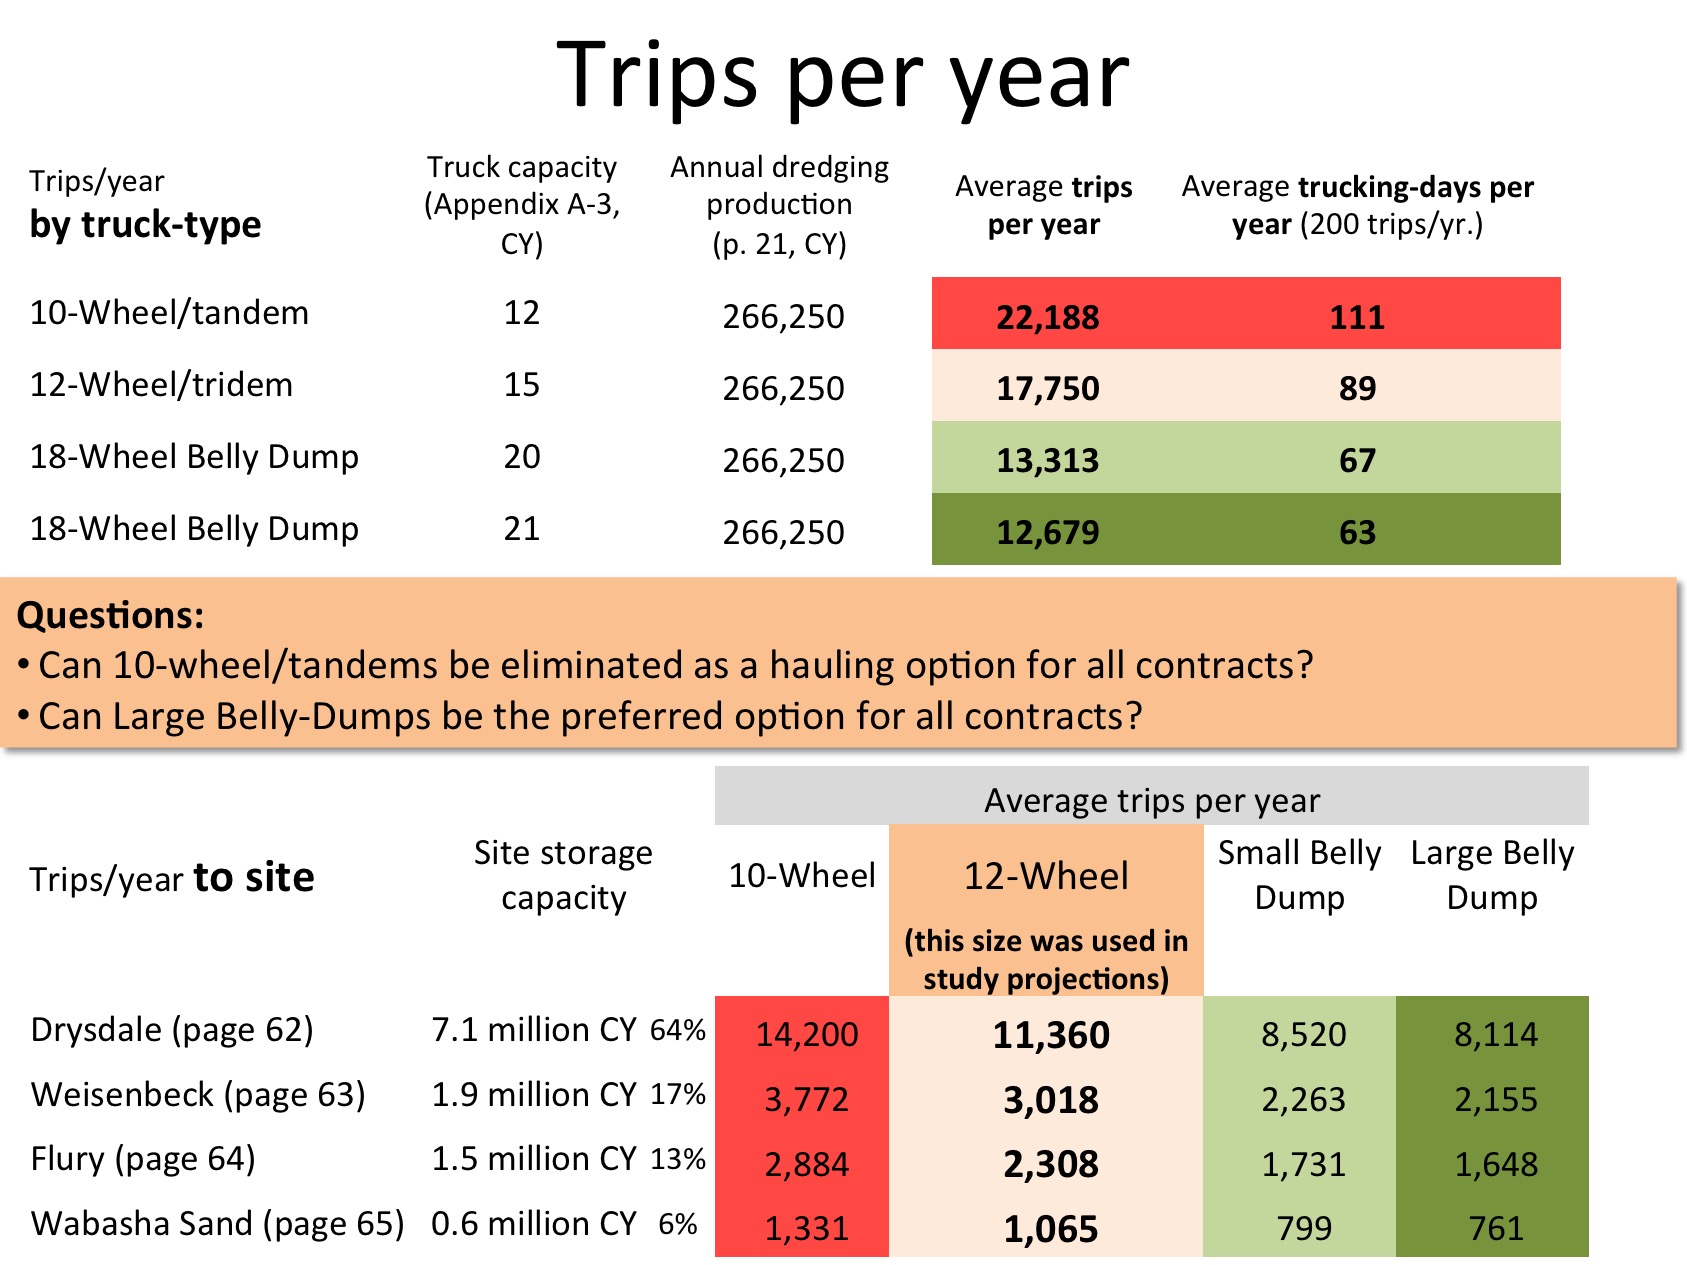
Here is my calculation of the total trips per year (by looking at the amount that will get hauled in an average year, the capacities of the trucks and where the sand is going). Note that top table of numbers is based on estimates of annual production but the trips are spread across the locations based on location capacity. I’m not happy using two different measures, but that’s the way the report did it. Again, these numbers are averages and will vary wildly from year to year depending on where dredging needs to be done.
I’ve color-coded the numbers to point out the difference the size of the trucks makes in number of trips. This will matter to the people along the haul routes.
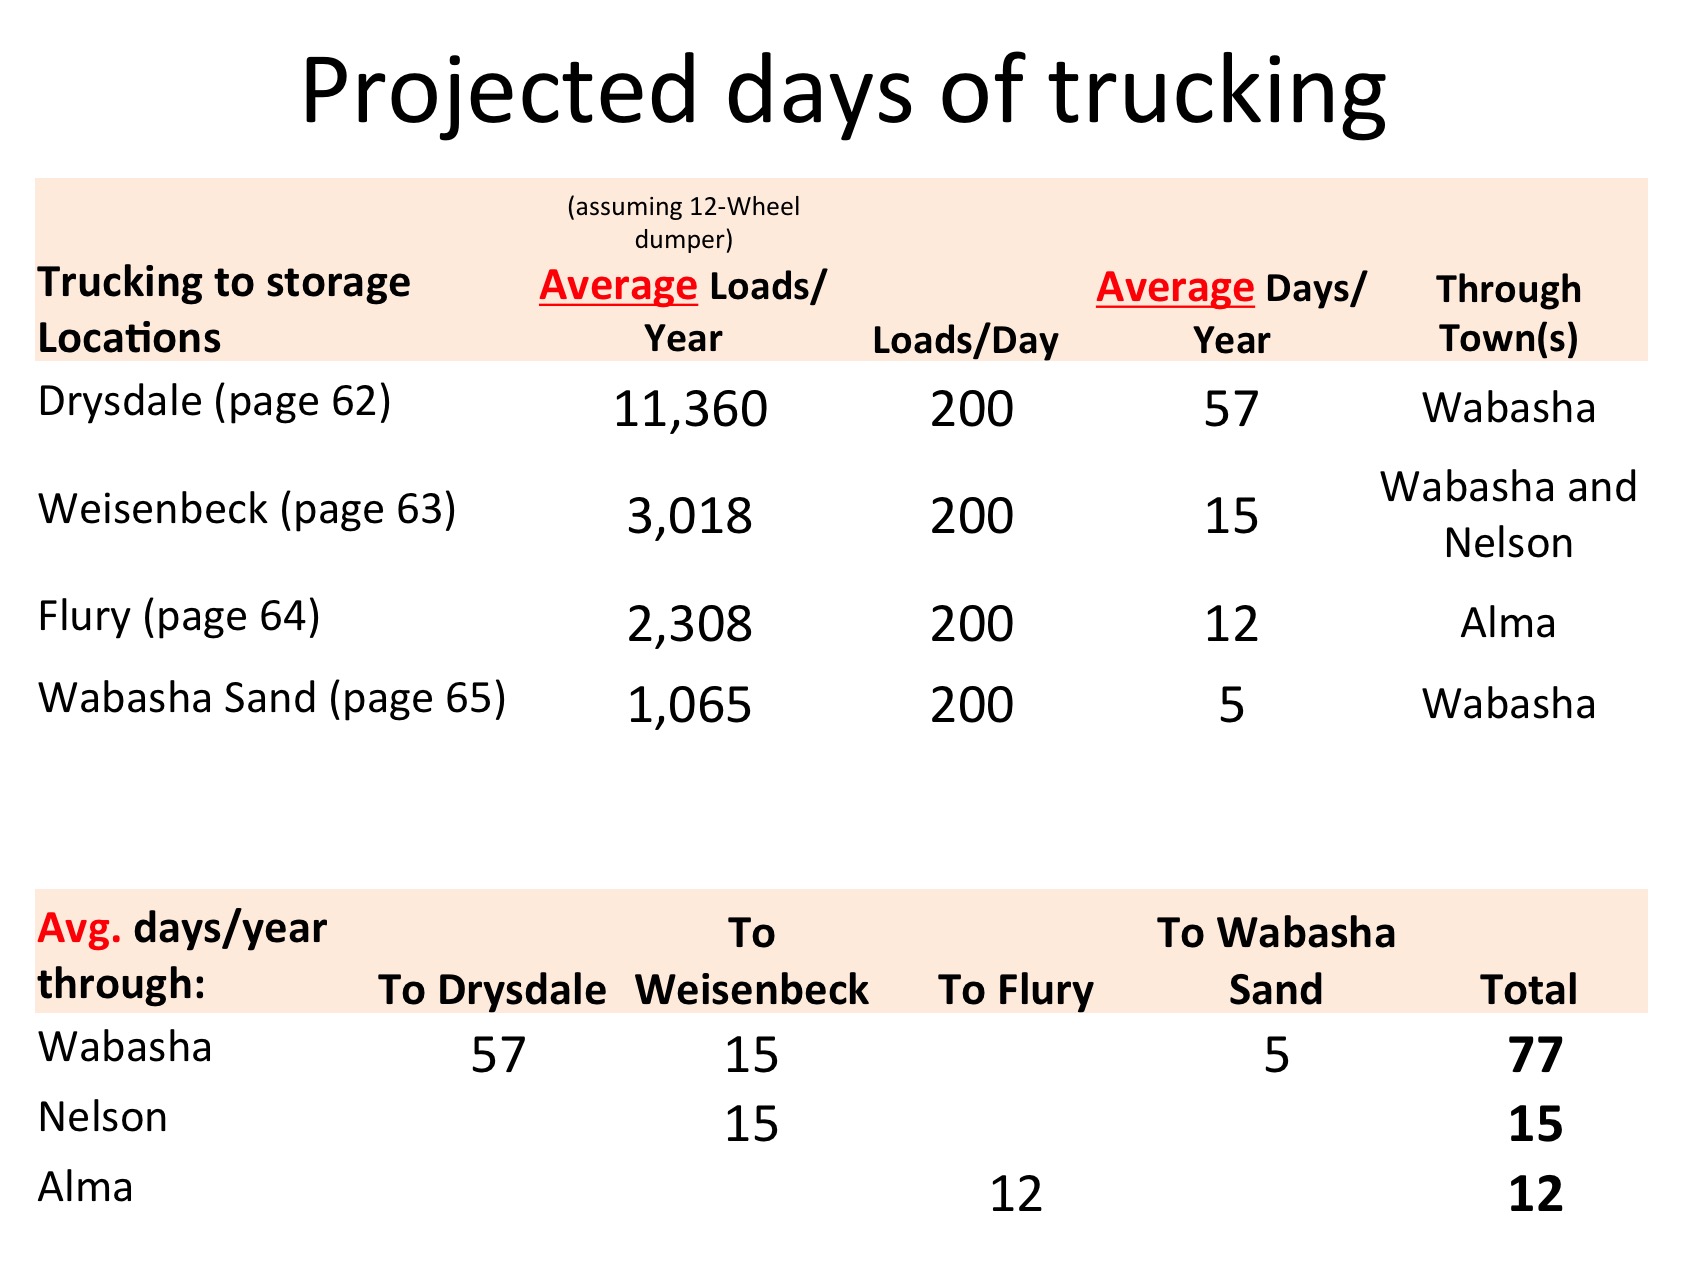
This slide documents how many of trucking-days a given town is going to experience. This is where things really start to get shaky, because of the heavy use of averages in the report. The reality in a given town will differ wildly from these numbers in any given year, because of the way the Corps of Engineers schedules and manages their work. So these numbers should be treated with great skepticism. Note: Wabasha has three haul routes which run through it, that’s why the three numbers are added together.
And finally, here’s my rant. After spending all that time digging pieces of information out of various places in the report, I realized that I was producing bogus conclusions about traffic volume and making this plan sound more manageable than it really is. In reality, the Corps makes absolutely no promises about the maximum number of truck trips through a town, or when those trips will happen. So businesses along the route are at risk of very unpleasant surprises all summer.